
Machine Learning with Python in Excel Part 1: Sourcing Data
Excel is now your go-to tool for do-it-yourself (DIY) analytics.

I’m going to repeat this throughout this tutorial series because it’s so important:
99% of the Python in Excel code you write is the same as any other Python technology (e.g., Jupyter Notebook or VS Code).
I assume you can access Python in Excel (PiE) in this tutorial series. Unfortunately, not every IT department has enabled this powerful new Excel feature yet (although it’s commonly enabled among my clients).
If you can’t access PiE via your work laptop, your personal Microsoft 365 subscription is another option. Check out Microsoft’s documentation for more details.
We will use a retail customer dataset for the first four tutorials of this series.
If you want to follow along by writing code (highly recommended), you can get the PythonInExcelML.xlsx workbook and CustomerBehavior.csv file from the newsletter GitHub repository.
BTW - If you’re new to machine learning, check out my Machine Learning in a Nutshell crash course.
OK. Let’s get started.
Sourcing Data with Power Query
Where PiE code differs from other Python technologies (e.g., Jupyter Notebook) is how you source data for your PiE analytics goodness.
Here are the best 3 methods for sourcing data for your PiE code (also known as Python formulas) in descending order of awesomeness:
Power Query connections
Excel tables
Cell ranges
This tutorial will demonstrate how to source data into PiE using these 3 methods.
First, the workbook has a simple Power Query connection (be sure to enable it when you open the workbook). In the Excel Ribbon, navigate to Data -> Existing Connections:
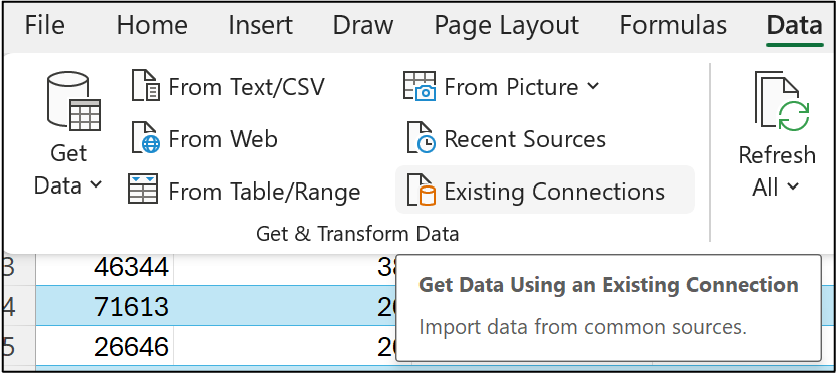
You should see the following dialog pop up:
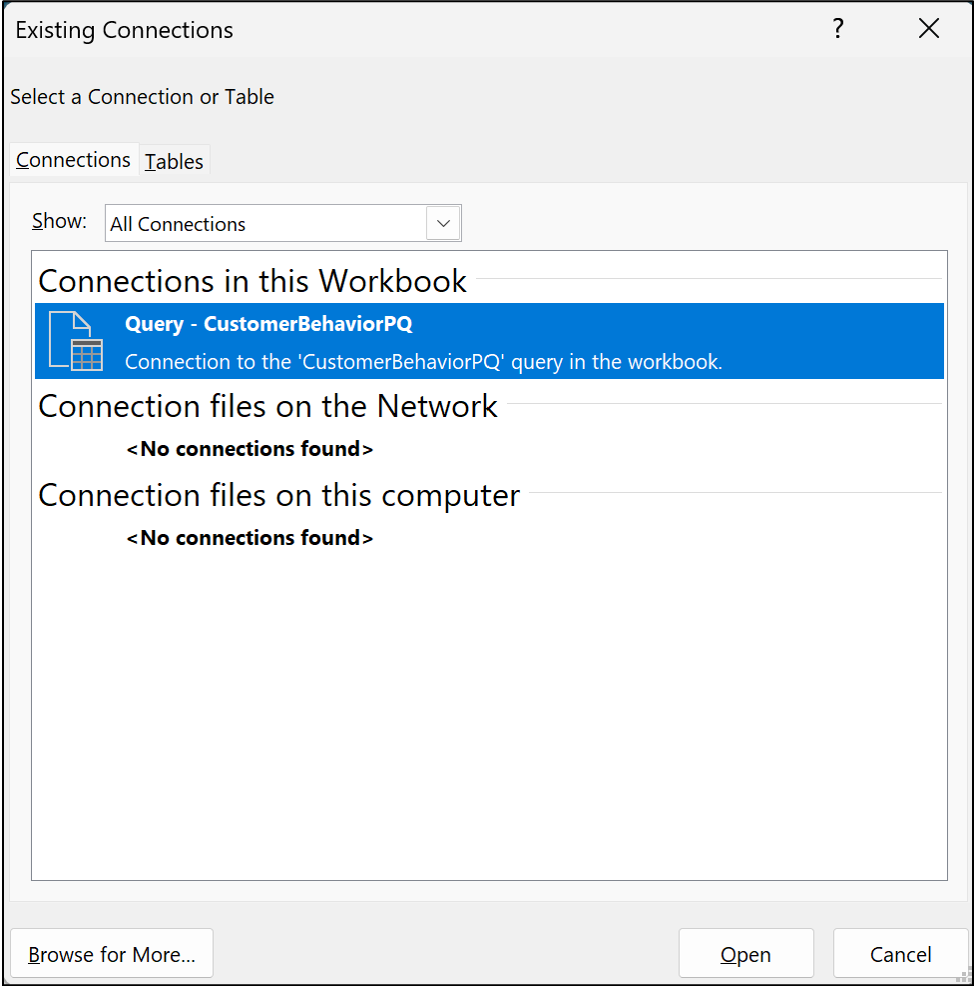
The name of the Power Query connection is CustomerBehaviorPQ. The PiE code will make use of this name.
Microsoft has designed PiE to use Power Query (PQ) to access external data sources (e.g., CSV files and databases). This is the most powerful way to analyze data in Excel in 2026.
The above PQ connection sources data from the CustomerBehavior.csv file from the newsletter GitHub repo. If you’re following along, please download this file as well.
Next, navigate to Formulas in the Excel Ribbon:
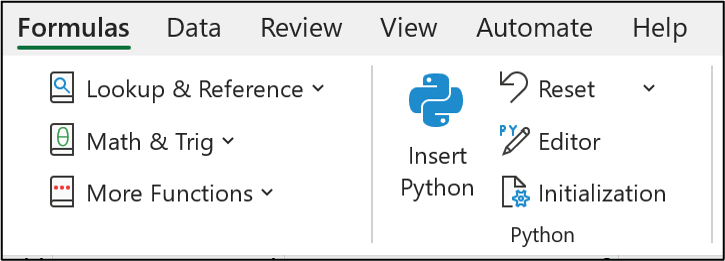
Check out the Microsoft documentation link above if you don’t see a Python section in your Ribbon.
The workbook contains a worksheet named Python Code. Technically, PiE code can run in any cell in a workbook. While it’s tempting to take advantage of this, don’t!
Organizing your PiE code consistently will help you eliminate mistakes and save time. That’s why I recommend (and use) dedicated worksheets for PiE code.
Clicking Insert Python from the Ribbon will invoke Excel’s new PY() function. This turns the cell to Python mode:
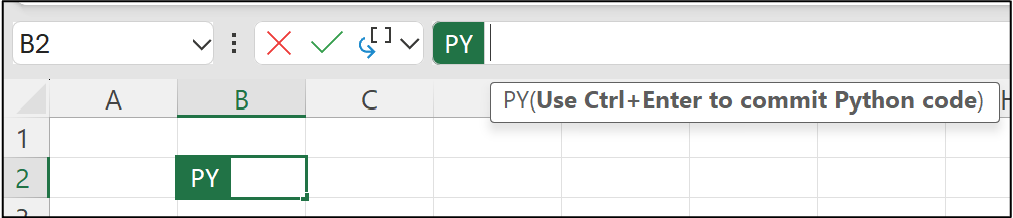
You can use Excel’s formula bar to enter your Python code if you prefer, but I strongly advise using the Python Editor.
As shown in the image above, cell B2 of the Python Code worksheet is selected. Instead of clicking Insert Python, click Editor:
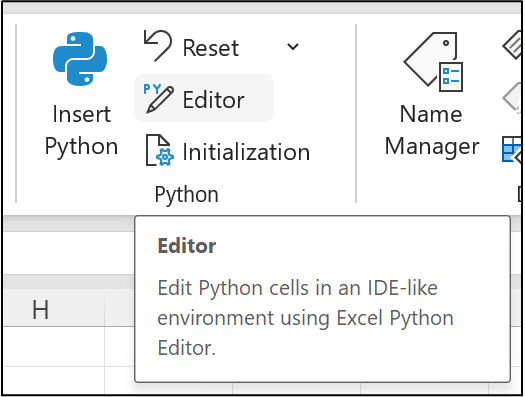
This will open the Python Editor pane:
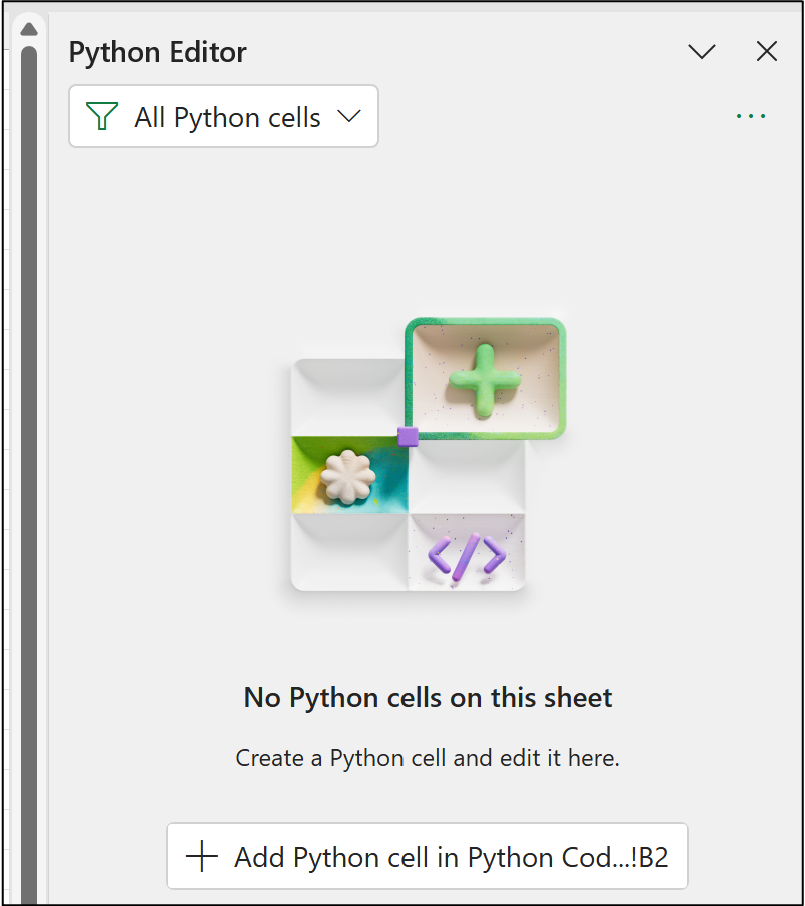
Clicking the Add Python cell... button calls the PY() function and gives you an enhanced experience for writing your PiE code:
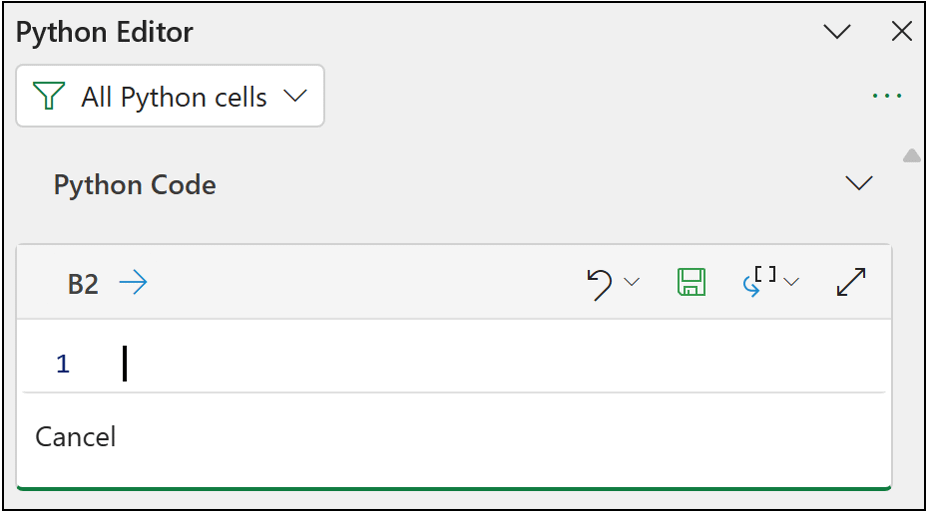
As shown in the image above, we can enter our Python formula in cell B2.
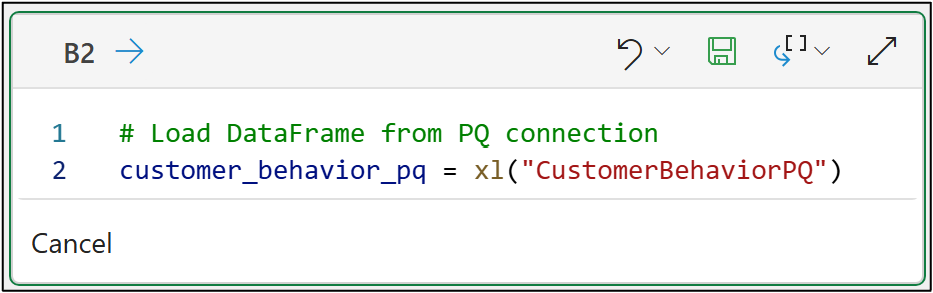
Here’s the code for loading a pandas DataFrame using the CustomerBehaviorPQ connection:
If you’re new to Python, my Python for Excel Users crash course will show you how your Microsoft Excel skills make learning Python easy.
Clicking the disk (i.e., Save) icon will run the Python code:
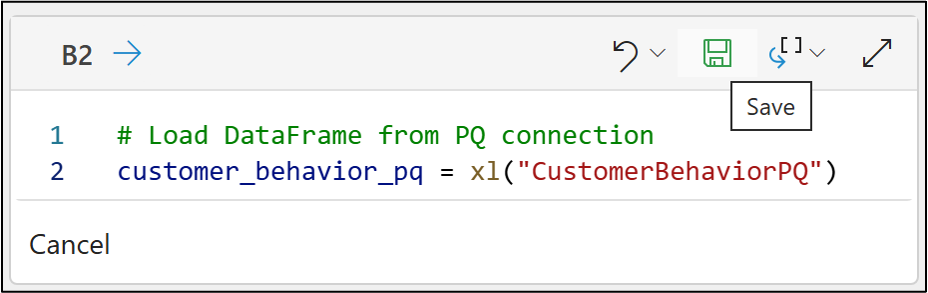
And here’s the code for your Excel workbook:
# Load DataFrame from PQ connection
customer_behavior_pq = xl("CustomerBehaviorPQ")
Conceptually, here’s what’s happening behind the scenes:
The PQ connection reads in the CustomerBehavior.csv file.
This data is passed to the new xl() function.
The data and code are uploaded to the Azure cloud.
A secure container is created in Azure to run the code with the data.
The results are then returned to Excel.
After the code is run in the Azure cloud, you can click on the DataFrame output in the Python Editor to get a preview of the DataFrame object:
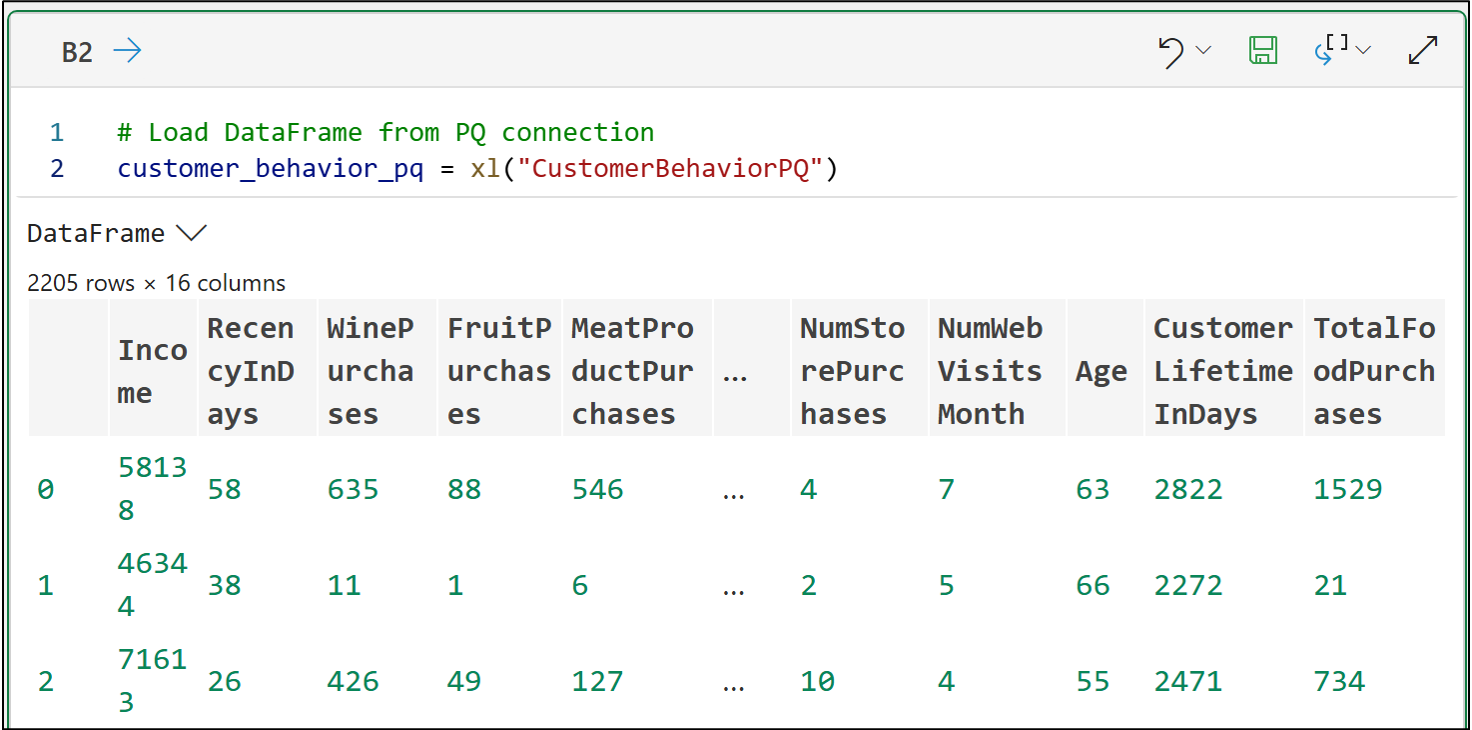
The new xl() function is the data gateway for your PiE code. For security reasons, your PiE code is very limited in what it can do. For do-it-yourself (DIY) analytics, your PiE code essentially does 3 things:
Source data via the xl() function.
Perform analytics on the data.
Return the results of these analytics (e.g., DataFrames, visualizations, ML models, etc.).
For more information on the xl() function, check out this Microsoft article.
As you do more and more DIY analytics with PiE, you will likely find that you increasingly rely on data sources outside your workbooks. This is where PQ connections come into play.
Sourcing Data From Excel Tables
It will also be common to source data from within your workbooks. A best practice is to use Excel tables as the primary data source for intra-workbook DIY analytics:
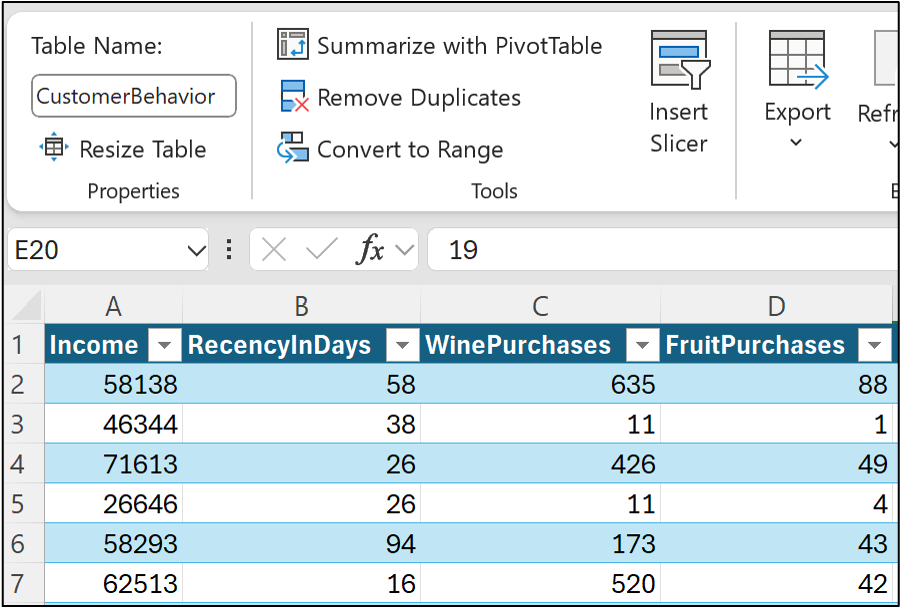
You also use the xl() function to load data from Excel tables by name (you do name your Excel tables, don’t you? 🤣).
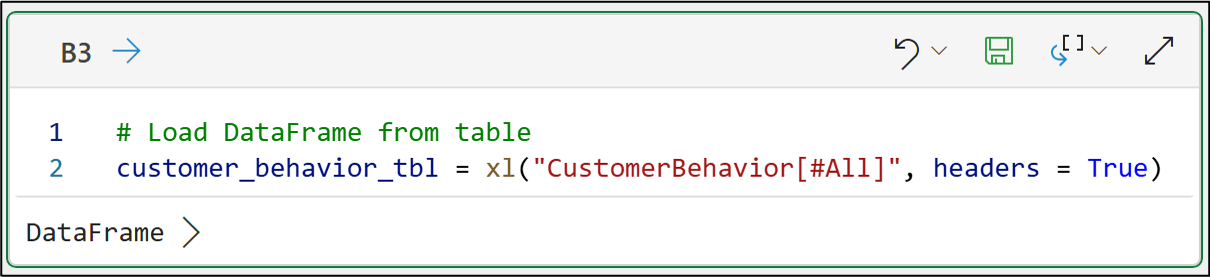
Clicking the following button in the Python Editor will add another Python formula in cell B3 of the Python Code worksheet:

And the code:
# Load DataFrame from table
customer_behavior_tbl = xl("CustomerBehavior[#All]", headers = True)
The above code specifies three things:
The Excel table name (i.e., CustomerBehavior).
The entire table should be loaded (i.e., [#All]).
The first row of the table is the column names (i.e., headers = True).
Clicking DataFrame in the Python Editor output will display a preview of the DataFrame (BTW - it’s the same as what you saw from the PQ code).
Oh, one last thing I must mention because it’s so critical.
With PiE, ensuring your cells have the correct data formats in tables/worksheets is more important than ever! The xl() function relies on cell formats to correctly convert the data to Python.
Sourcing Data From Cell Ranges
Lastly, you can use the xl() function to load data from a specified cell range. While this is possible, please don’t do it!
Using Excel tables is better because they force you to organize your data properly for DIY analytics (e.g., customer segmentation, forecasting, machine learning).
Here’s the code in cell B4 of the Python Code worksheet:
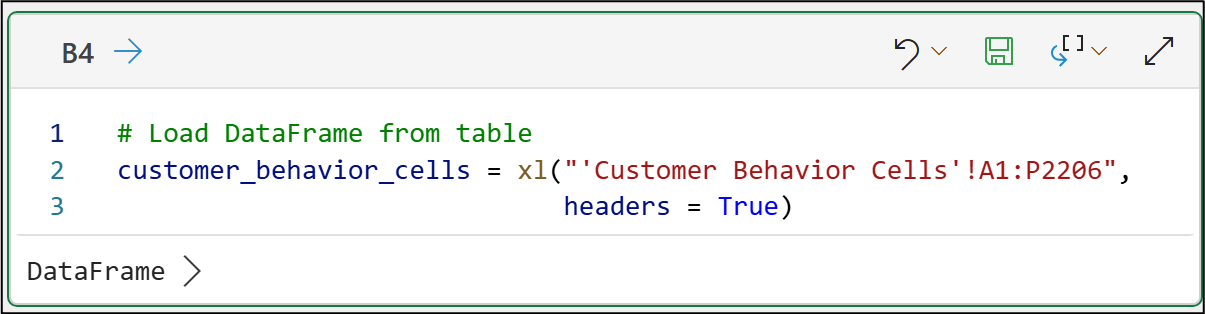
# Load DataFrame from table
customer_behavior_cells = xl("'Customer Behavior Cells'!A1:P2206", headers = True)
You’ve probably noticed that I’ve been writing the PiE code in the same column and moving down a row for each new Python formula.
I highly recommend you do this. Here’s a screenshot of how I typically organize my PiE code:
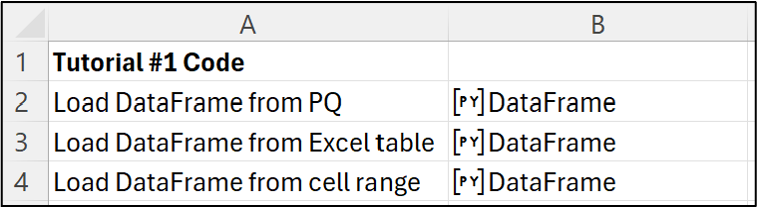
If you’re familiar with Jupyter Notebooks, you’ll notice that this style is very similar to how you build a Jupyter Notebook.
This is an engineering practice for building maintainable PiE workbooks, but it is not required.
As I mentioned previously, you can make any cell a Python formula. To handle the nature of Excel cells and worksheets, PiE uses a specific calculation order that you must understand.
From the Microsoft documentation:
“Traditional Python statements calculate from top to bottom. Within a Python in Excel cell, Python statements do the same thing—they calculate from top to bottom. But in a Python in Excel worksheet, Python cells calculate in row-major order. The cell calculations run across a row (from column A to column XFD), and then across each following row down the worksheet.
Python statements are ordered, so each Python statement has an implicit dependency on the Python statement that immediately precedes it in the calculation order.
The calculation order is important when defining and referencing variables in a worksheet, because you must define variables before you can reference them.”
BTW - What isn’t mentioned above is that the calculation order also goes worksheet by worksheet from left to right.
Trust me, building your workbooks relying on PiE calculation order is a recipe for disaster.
Keep your PiE code in dedicated worksheets and vertically organize your Python formulas as I show above.
Your future self will thank you.
👉 Ready to learn more? Check out Part 2 here.
That’s it for this tutorial.
My next tutorial in this series will cover how to profile data for machine learning using Python in Excel.
Stay healthy and happy data sleuthing!
👩🏫 Ready to Learn More Analytics Skills?
My paid subscribers have access to exclusive monthly live crash courses that include:
PDFs of all slides.
Excel workbooks, code, and data.
Recordings so you can learn on your schedule.
Check out one of my latest live crash courses:

This is rich.
Would be back to try this with my laptop