
Hierarchical Clustering with Python Part 1: Introduction
Don't make the same mistake I made by ignoring cluster analysis. It's wildly useful for ANY professional!

There’s an unfortunate reality when it comes to how data science is defined in social media and most organizations:
Data science == machine learning.
Machine learning == predictive ML models.
Predictive ML models == production deployments.
Before I get a bunch of 🔥 comments and email replies, let me state something for the record.
When done well, the business value of production ML predictive models can be substantial.
However, these situations are typically the exception rather than the rule. This has been my hands-on experience with my clients and is also reported in industry data collected by TDWI, Forrester, and Gartner.
For example, the percentage of ML projects intended for production but never make it is very high.
This is unfortunate, because what often gets lost in the discussions about data science is that there are two forms of ML commonly used in business analytics:
Supervised Learning: The machine learns from labeled examples.
Unsupervised Learning: The machine learns from unlabeled examples.
Supervised Learning is how you craft ML predictive models, such as decision trees and random forests. These models learn from datasets in which each row contains an outcome of interest (i.e., the label).
For example, you work for a governmental agency and want to craft an ML model to predict claims fraud. Every row of your historical dataset needs a label indicating whether a claim was fraudulent.
Supervised Learning gets all the love in social media, but there’s a problem.
Most of the world’s data is unlabeled - including the data in your organization.
So what do you do?
You use Unsupervised Learning.
Introducing Cluster Analysis
More specifically, you use a form of Unsupervised Learning called cluster analysis. Here’s a definition from my favorite machine learning textbook:
“Cluster analysis groups data objects based only on information found in the data that describes the objects and their relationships.
The goal is that the objects within a group be similar (or related) to one another and different from (or unrelated to) the objects in other groups.
The greater the similarity (or homogeneity) within a group and the greater the difference between groups, the better or more distinct the clustering.”
Because so much real-world data is unlabeled, cluster analysis is a widely used tool in analytics for discovering structure and generating new insights.
While many forms of cluster analysis have been invented over the years, the three clustering algorithms that are most used in business analytics are:
K-means clustering
DBSCAN clustering
Hierarchical clustering
The third is the subject of this newsletter tutorial series.
If you’re serious about building analytics skills, my Cluster Analysis with Python online course will teach you how to use k-means and DBSCAN in a weekend.
Introducing Hierarchical Clustering
Based on the above definition, hierarchical clustering mines groupings from unlabeled datasets. What distinguishes hierarchical clustering is how the mined groupings are defined.
The easiest way to intuit how hierarchical clustering works is to see a typical real-world example:
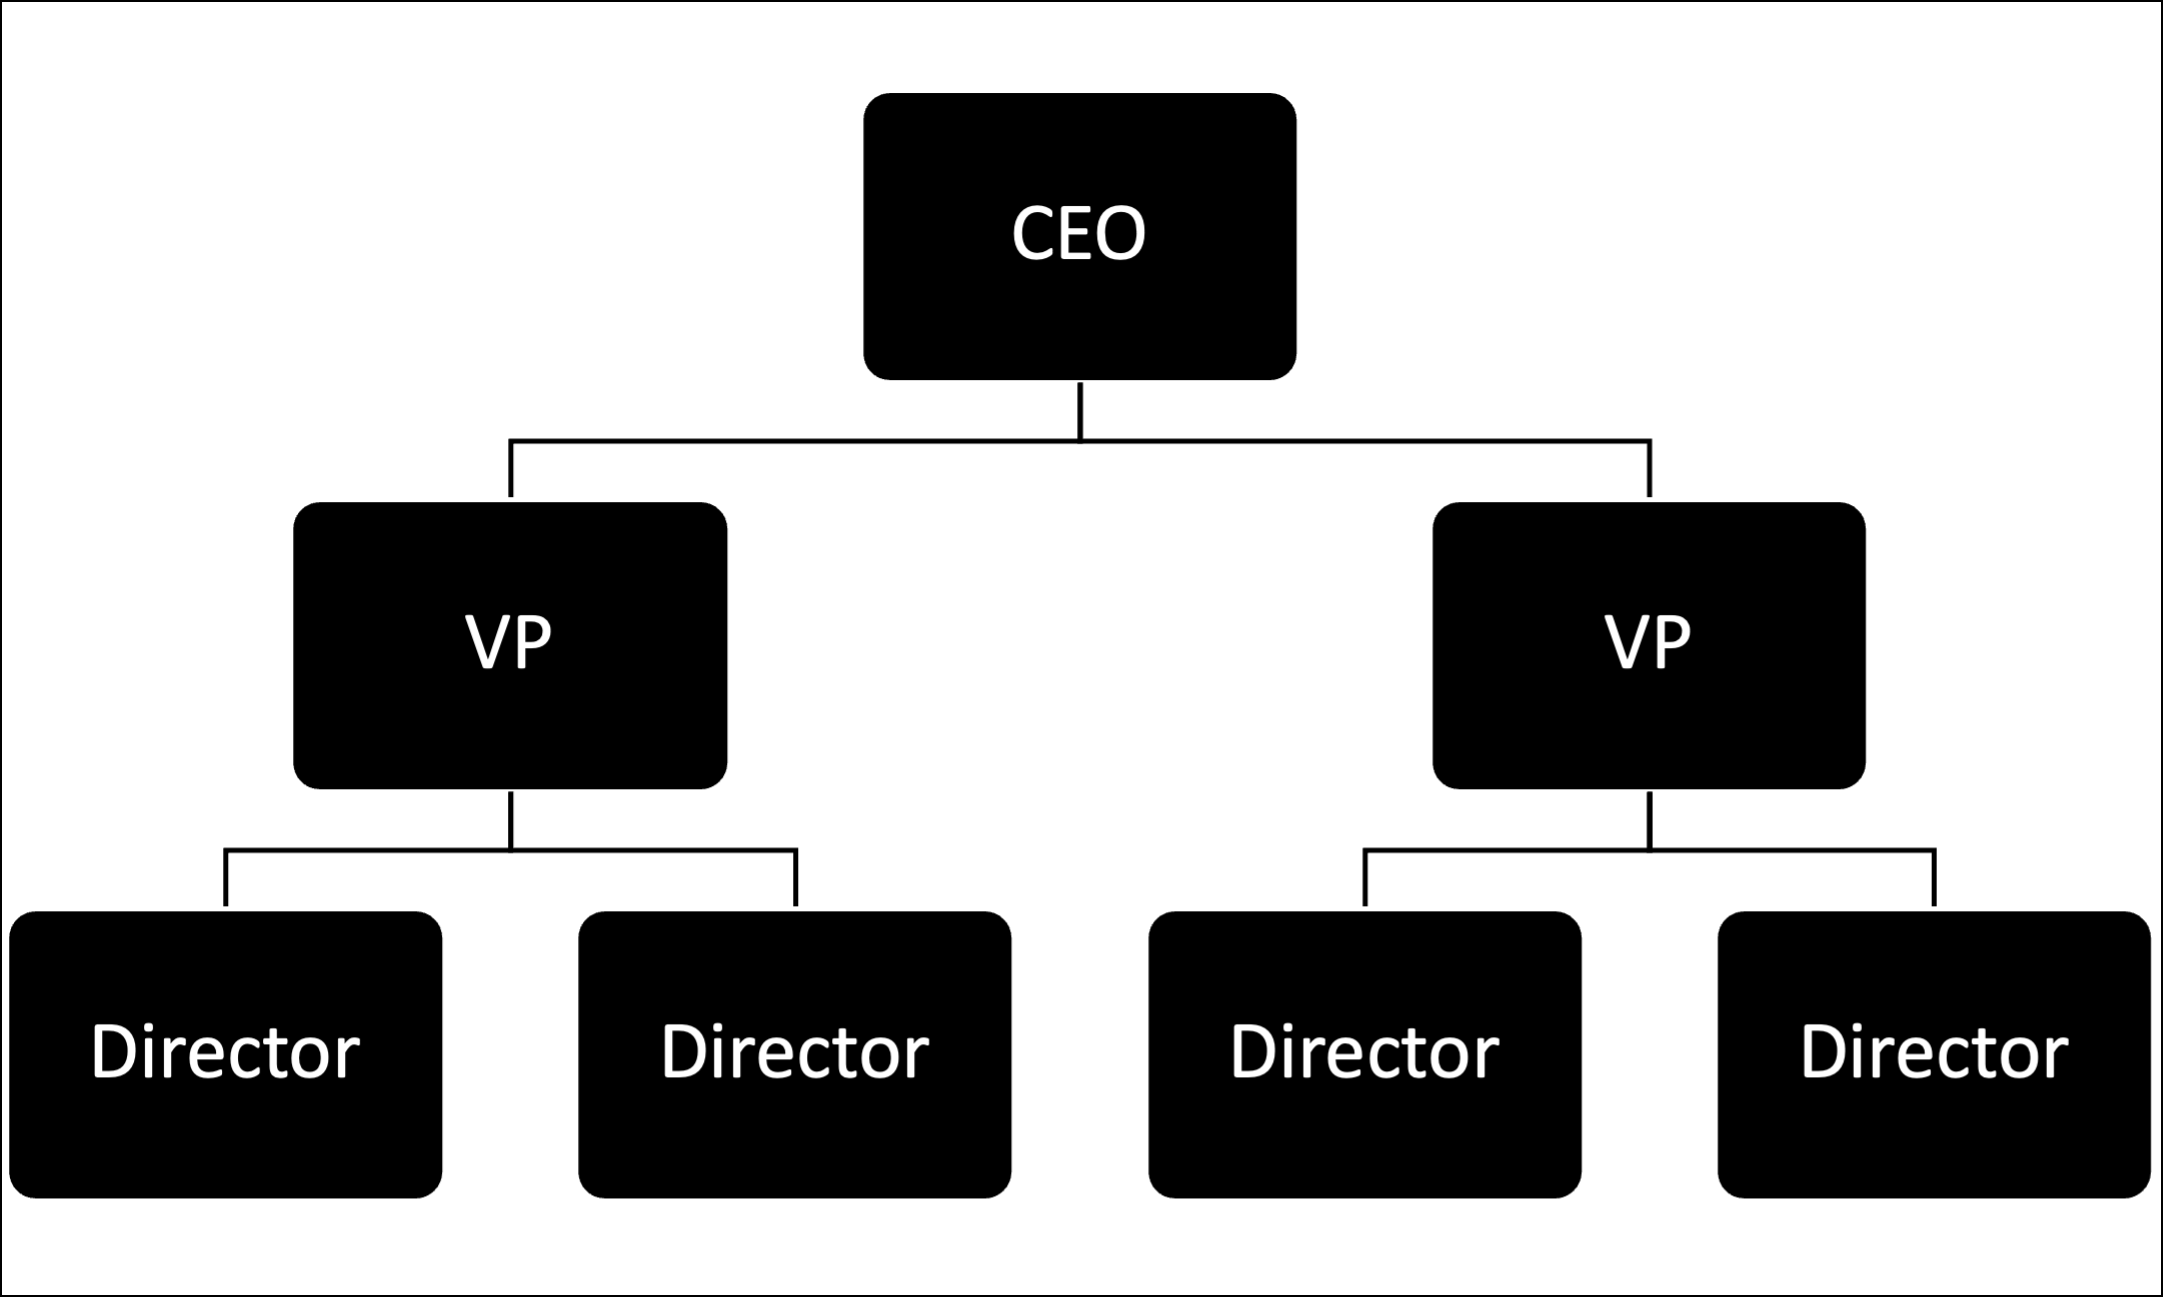
The image above is a typical representation of a company - an org chart. This is an example of hierarchical clustering. Organizations worldwide cluster employees based on management hierarchies.
BTW - In machine learning terminology, the diagram above is known as a dendrogram and is commonly used to visualize hierarchical clustering results.
Hierarchical clustering can take an unlabeled dataset and mine a hierarchical structure (often referred to as a taxonomy) directly from the data.
You can then analyze the hierarchical clustering to derive new insights based on your business/processes.
For example, consider the highlighted portion of the dendrogram below:
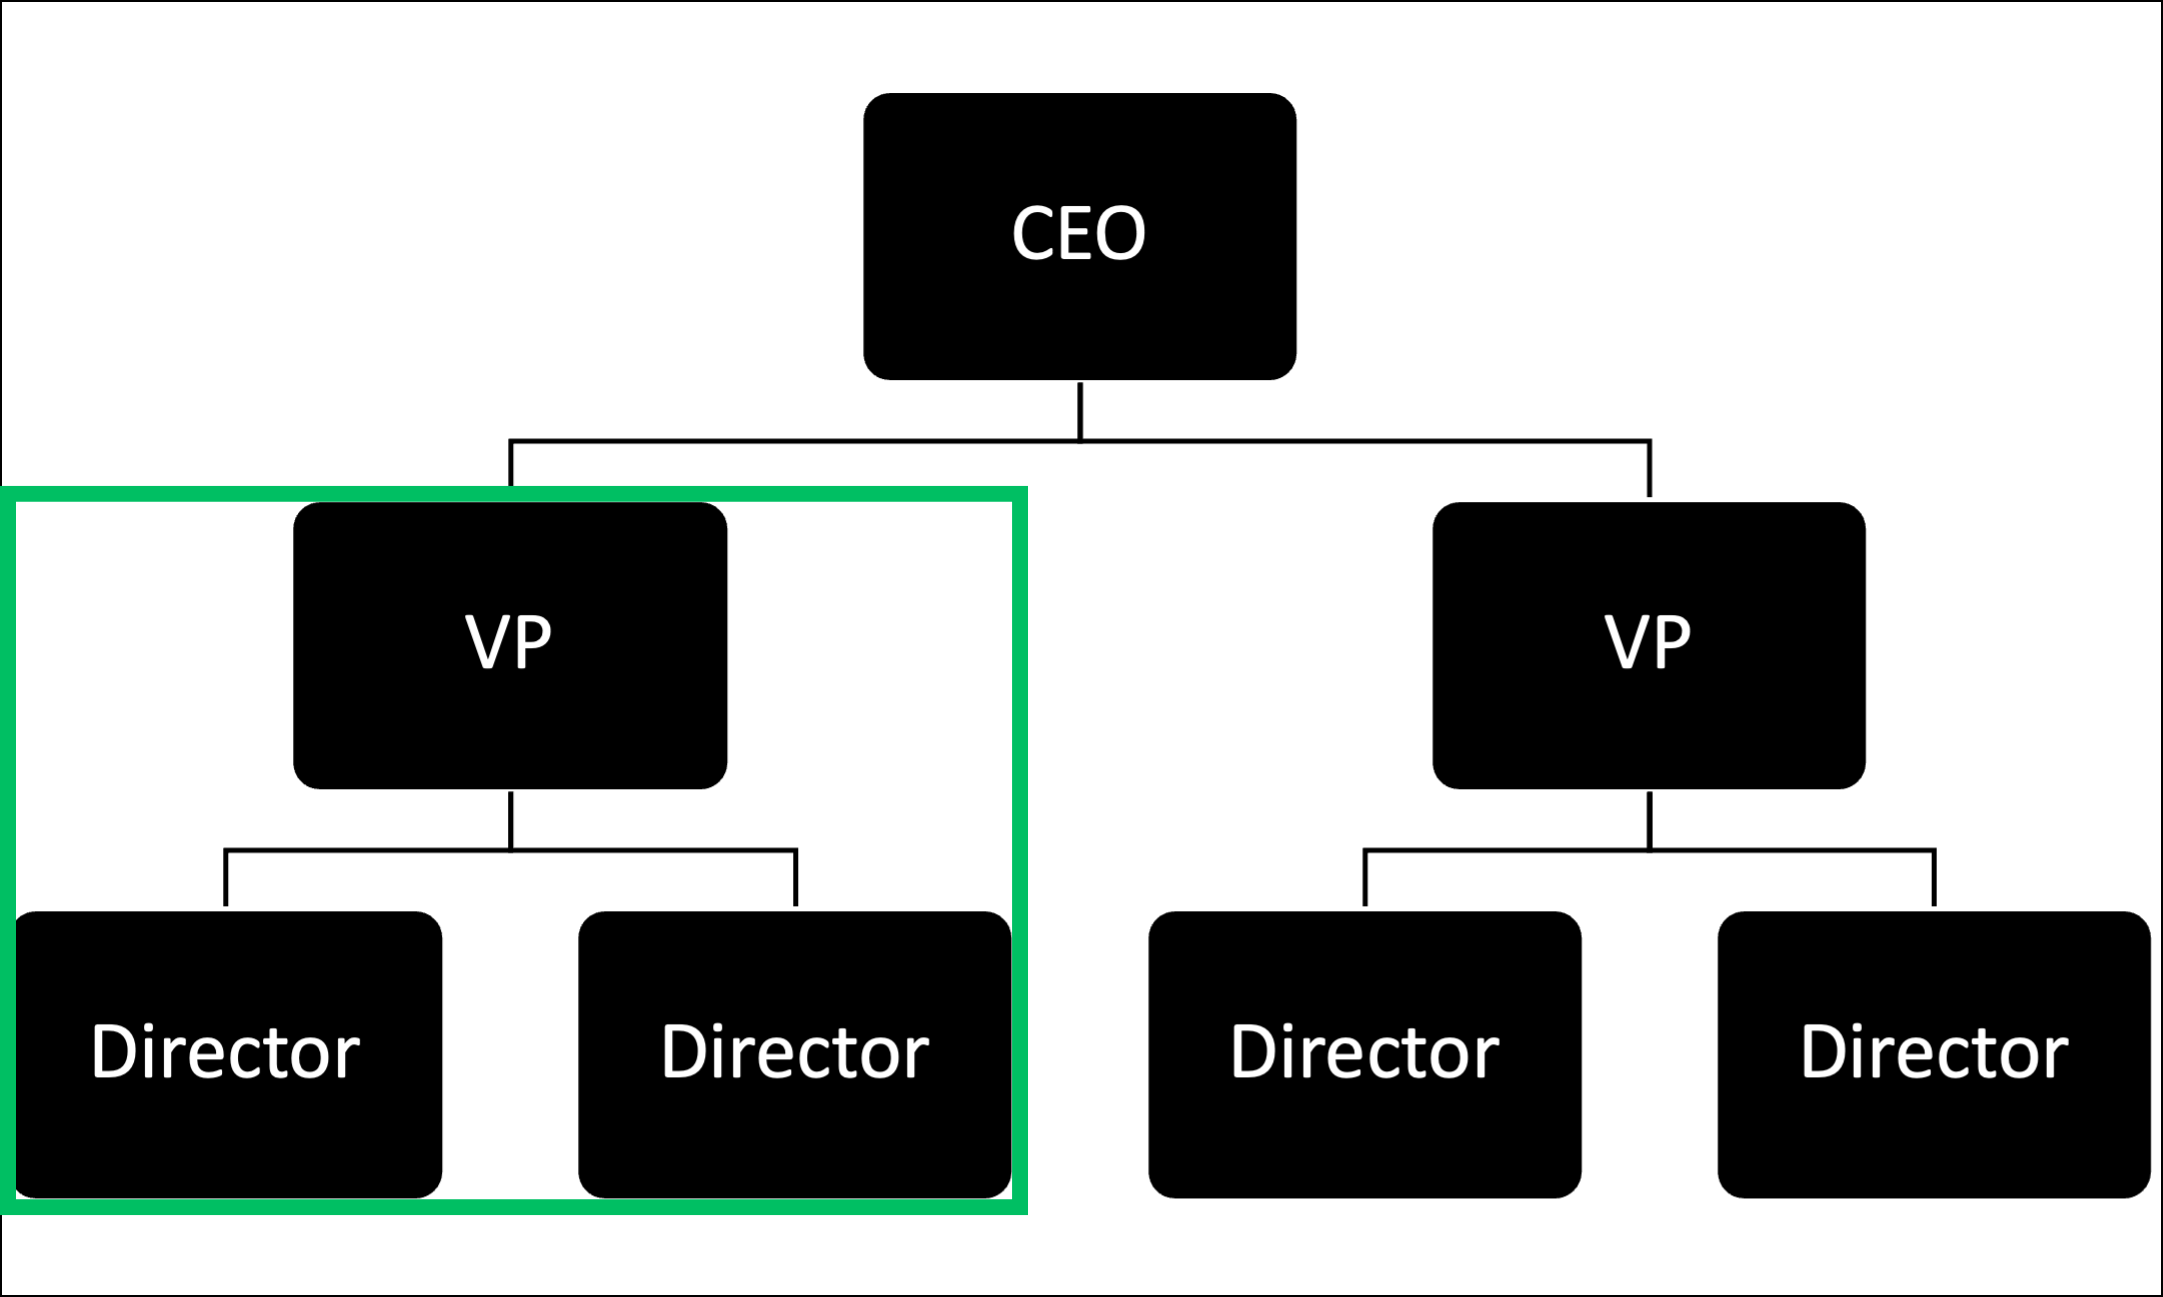
Let’s assume you’re unfamiliar with the above organization and its people. You can use hierarchical clustering to derive insights like:
“The lower left cluster comprises observations (i.e., employees) with titles indicative of supply chain management functions.”
“The lower right cluster comprises observations with titles indicative of manufacturing functions.”
“The upper cluster appears to represent the organization’s manufacturing and supply chain division.”
While a contrived example to be sure, the above illustrates that cluster analysis is a universally applicable skill:
Marketing: Segmenting customers into groups for more effective campaigns.
IT Operations: Anomaly detection in network operations and security.
Text Analytics: Group documents based on similar content.
Healthcare: Mining patient data for groups to improve outcomes.
The list is endless!
If you’re serious about having more impact at work using data, you want skills with cluster analysis!
👉 Want to learn more? Check out Part 2 here.
That’s it for this tutorial.
My next newsletter will continue this tutorial series by teaching you how the hierarchical clustering technique works.
Stay healthy and happy data sleuthing!
👩🏫 Ready to Learn More Analytics Skills?
My paid subscribers have access to exclusive monthly live crash courses that include:
PDFs of all slides.
Excel workbooks, code, and data.
Recordings so you can learn on your schedule.
Here are some examples of my live crash courses:


As it is computationally expensive, what sort of solution is there for massive datasets? Would / could you use a partitioning system, so to speak, in a hybrid fashion?